Distribution of X̄ - Ȳ from Normal Distributions
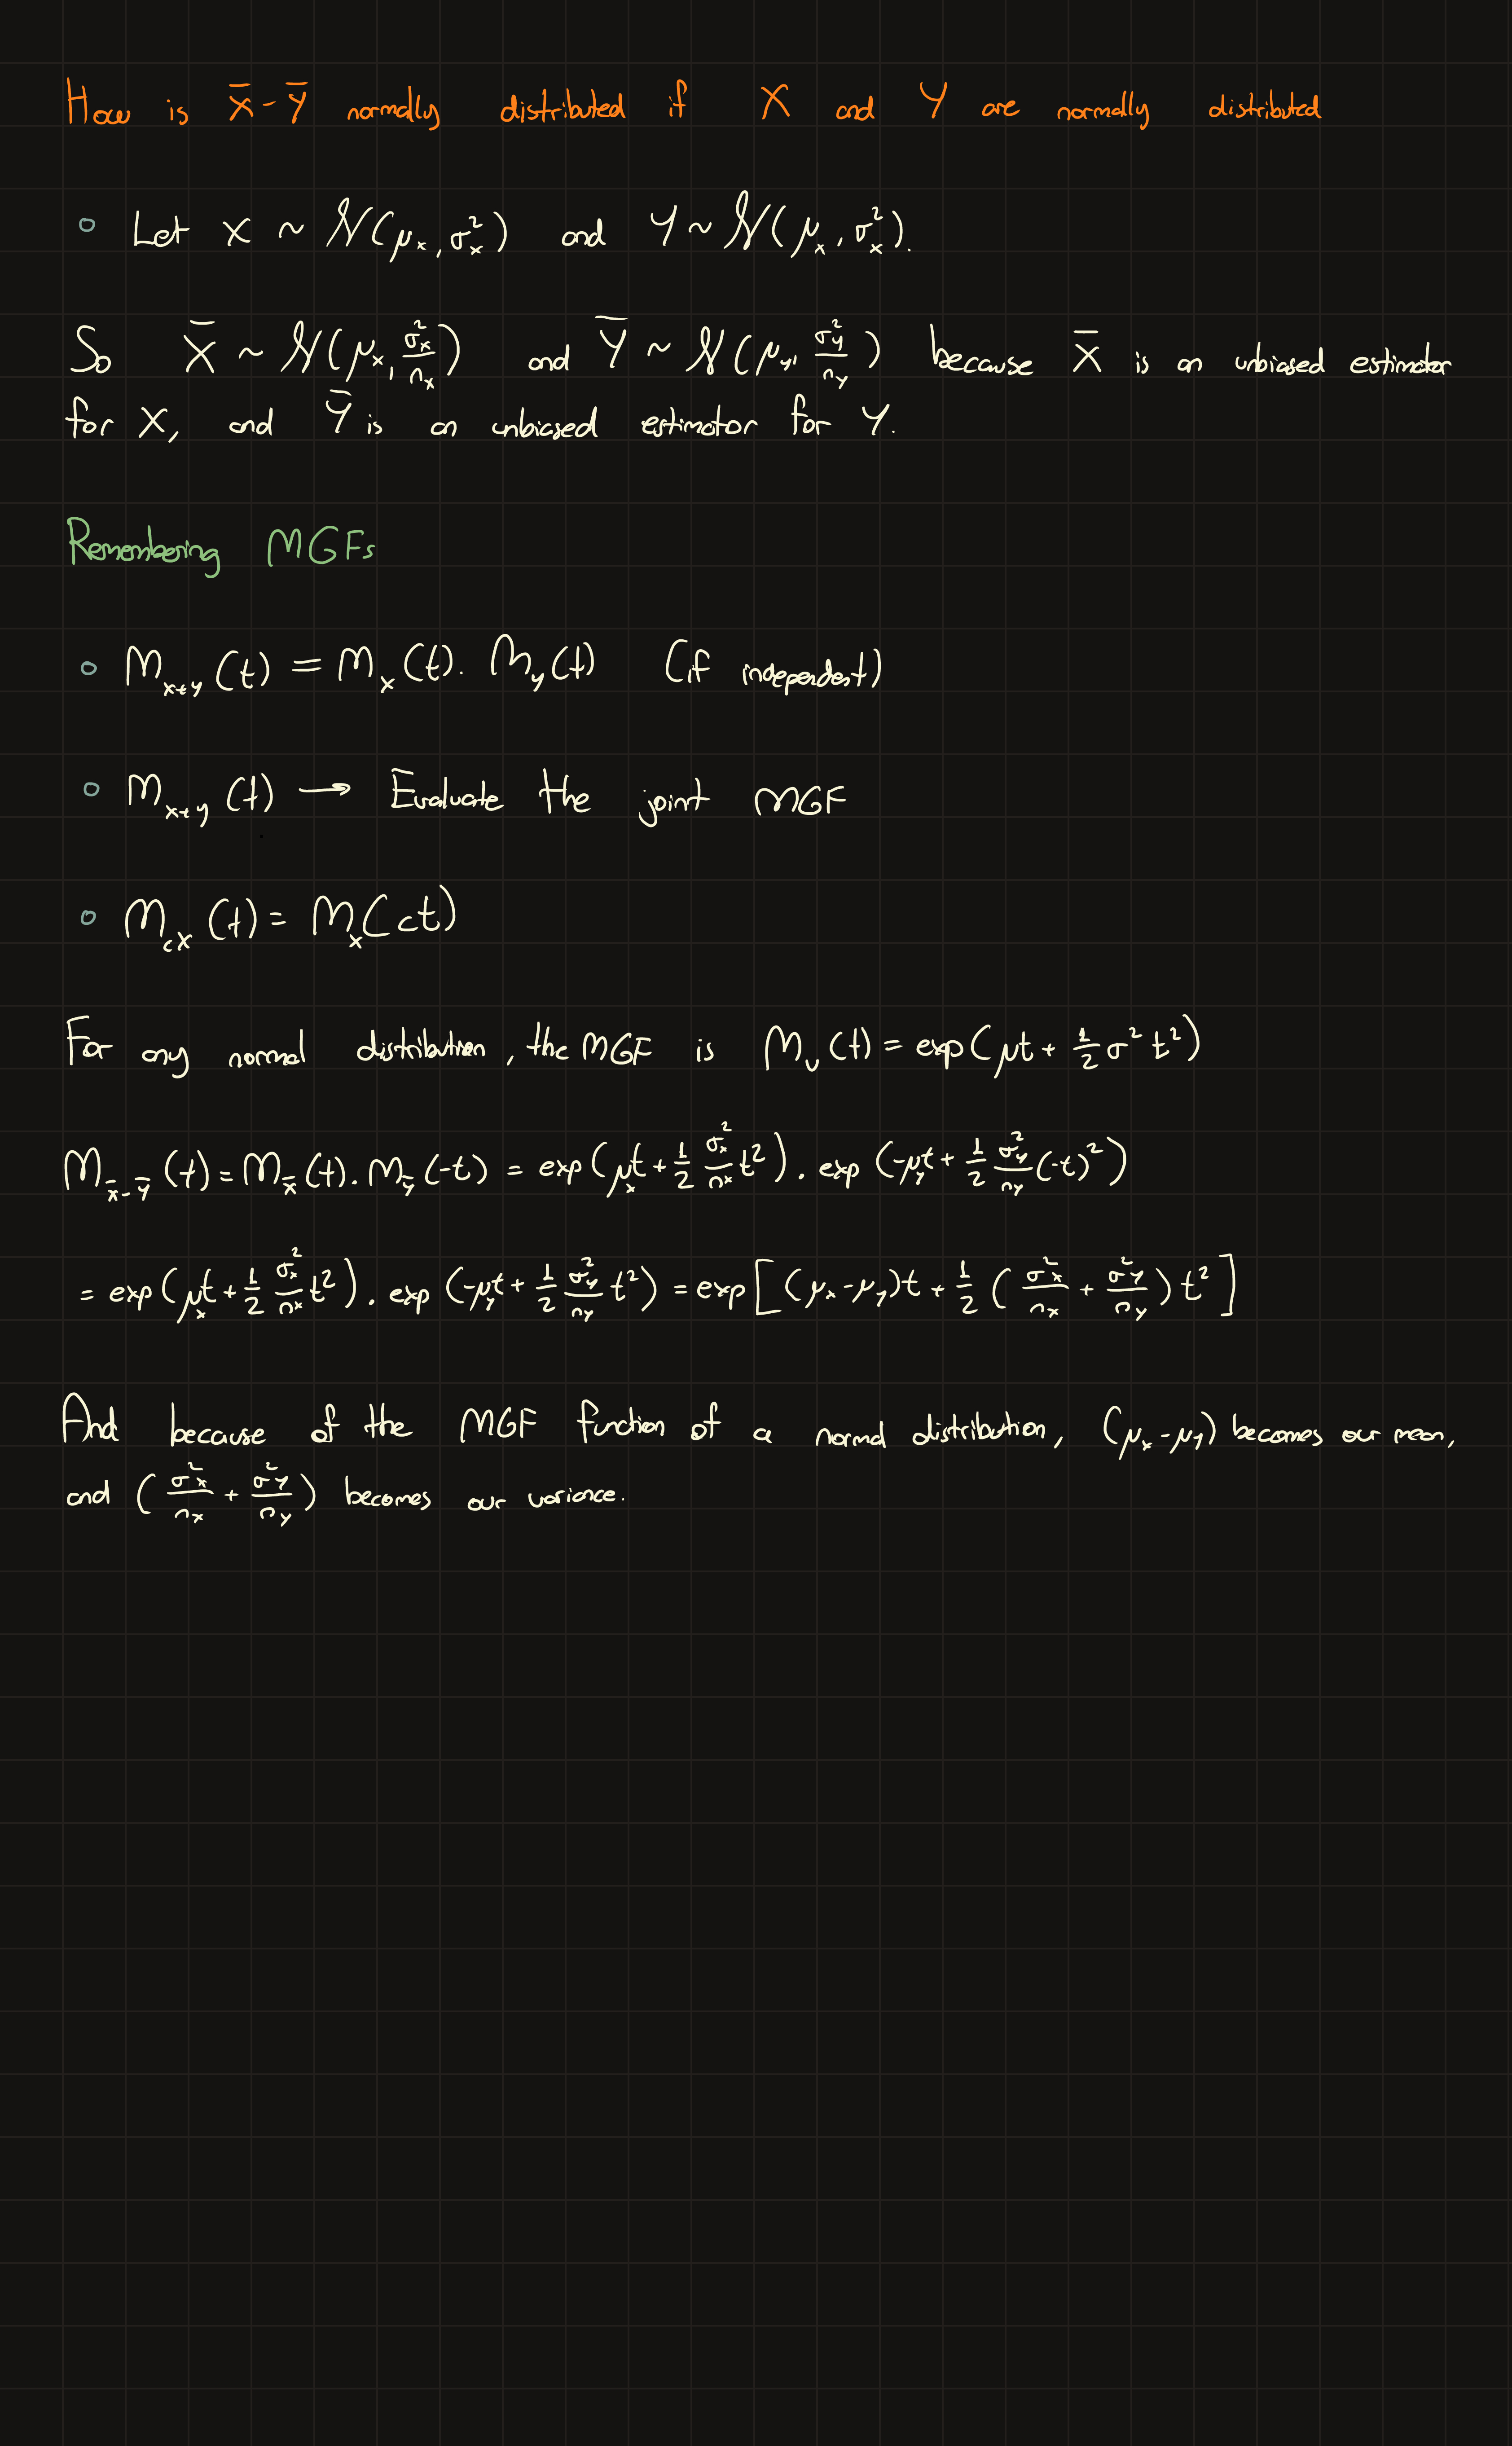
How is $\bar{X} - \bar{Y}$ normally distributed if X and Y are normally distributed?
import numpy as np
import pandas as pd
import matplotlib.pyplot as plt
import seaborn as sns
Let's create two random datasets first, we are going to apply CLT first.
x = np.random.randint(0, 20_000, 5000)
y = np.random.randint(20_000, 100_000, 2000)
x[:10], y[:10]
Our first dataset consists of 5000 integer data points, between 0 and 20.000. And our second dataset consists of 2000 integer data points, between 20.000 and 100.000. They are non-overlapping on purpose, and the purpose is to see the wanted reuslt clearer.
means_x = np.array(
    [np.mean(np.random.choice(x, size=30, replace=False)) for i in range(5000)]
)
means_y = np.array(
    [np.mean(np.random.choice(y, size=30, replace=False)) for i in range(5000)]
)
We sampled 5000 times from each dataset, and the sample size is 30 for the both.
fig, ax = plt.subplots()
sns.kdeplot(means_x, ax=ax, label="x")
sns.kdeplot(means_y, ax=ax, label="y")
ax.legend()
plt.show()

Because of CLT, we have a two normally distributed data. And the means and the standard deviations are different.
means_minus = means_x - means_y
fig, ax = plt.subplots()
sns.kdeplot(means_x, ax=ax, label="x")
sns.kdeplot(means_y, ax=ax, label="y")
sns.kdeplot(means_minus, ax=ax, label="minus")
ax.legend()
plt.show()

Statistical notation of means_minus = means_x - means_y is $\bar{X} - \bar{Y}$. And as you can see, means_minus is also normally distributed.
We know that:
- $Var\[\bar{X} - \bar{Y}\] = Var\[\bar{X}\] + Var\[\bar{Y}\]$
- $E\[\bar{X} - \bar{Y}\] = E\[\bar{X}\] - E\[\bar{Y}\]$
Let's prove it.
mean_means_x = np.mean(means_x)
mean_means_y = np.mean(means_y)
var_means_x = np.var(means_x)
var_means_y = np.var(means_y)
np.mean(means_minus), mean_means_x - mean_means_y
np.var(means_minus), var_means_x + var_means_y
Yes, it is indeed correct.
TODO: Mathematically prove the below conclusions:
- $Var\[\bar{X} - \bar{Y}\] = Var\[\bar{X}\] + Var\[\bar{Y}\]$
- $E\[\bar{X} - \bar{Y}\] = E\[\bar{X}\] - E\[\bar{Y}\]$
TODO: Why do we need X and Y to be normally distributed, doesn't CLT already do that for us?
Proof of Estimators